'DecisionTree'에 해당되는 글 3건
!['[Python] RandomForest 예제' 포스트 대표 이미지](https://img1.daumcdn.net/thumb/R750x0/?scode=mtistory2&fname=https%3A%2F%2Fblog.kakaocdn.net%2Fdna%2FbIl3sU%2FbtqxKrzhDIg%2FAAAAAAAAAAAAAAAAAAAAAEIsXw5fAlQZRfhV-vX_XeBI7aqjdORbRo2ZJzPD8ZT1%2Fimg.png%3Fcredential%3DyqXZFxpELC7KVnFOS48ylbz2pIh7yKj8%26expires%3D1782831599%26allow_ip%3D%26allow_referer%3D%26signature%3DNhFCYn3FGpeO5YYZHTFsftkLotY%253D)
!['[Python] RandomForest' 포스트 대표 이미지](https://img1.daumcdn.net/thumb/R750x0/?scode=mtistory2&fname=https%3A%2F%2Fblog.kakaocdn.net%2Fdna%2FOsAjl%2FbtqxKq1osXO%2FAAAAAAAAAAAAAAAAAAAAAG62p_Mlg_HcsEWl-3TXWgkJKXCgY8OUne40IYBgipbk%2Fimg.png%3Fcredential%3DyqXZFxpELC7KVnFOS48ylbz2pIh7yKj8%26expires%3D1782831599%26allow_ip%3D%26allow_referer%3D%26signature%3Dwu0AGHJ5FU0mLjs9JufqFfM%252Fr1I%253D)
!['[Python] DecisionTree' 포스트 대표 이미지](https://img1.daumcdn.net/thumb/R750x0/?scode=mtistory2&fname=https%3A%2F%2Fblog.kakaocdn.net%2Fdna%2FWjbBm%2FbtqxKBBD8Za%2FAAAAAAAAAAAAAAAAAAAAADdePnYMWnqQdZM_WcL9KTXMfn_IedTX1nRbfIZABjIJ%2Fimg.png%3Fcredential%3DyqXZFxpELC7KVnFOS48ylbz2pIh7yKj8%26expires%3D1782831599%26allow_ip%3D%26allow_referer%3D%26signature%3DCQecAyUdslIG%252Bv0Rq4gopkK1dzQ%253D)
[Python] RandomForest 예제
- breast_cancer 데이터를 이용하여 적합한 randomforest의 트리 개수와, 특정값을 구해보자
# 1 데이터 호출
from sklearn.datasets import load_breast_cancer
breast_cancer_dataset = load_breast_cancer()

# 1-1 데이터 분류
X_train,X_test,y_train,y_test = train_test_split(X,y, test_size = 0.3, random_state = 10)

# 2 n_estimators
depths=range(5,201,5)
forest_train,forest_test = [],[]

for i in depths:
    forest = RandomForestClassifier(n_estimators=i, random_state=i)
    forest.fit(X_train,y_train)

    forest_train.append(forest.score(X_train,y_train))
    forest_test.append(forest.score(X_test,y_test))

plt.plot(depths,forest_train,label='훈련 정확도',marker='o')
plt.plot(depths,forest_test,label='테스트 정확도',marker='o')
plt.ylabel('accuracy')
plt.xlabel('number of n_estimators')
plt.legend()
2. n_n_estimators 는 randomforest에서 의사결정나무의 개수를 정해준다고 했습니다.
그럼 적합한 나무의 개수가 무엇인지 확인하기 위해 range를 통해 다양한 숫자를 넣어 그래프로 train,test의 정확도를 확인해보았습니다. (random_state도 같이 증가시켜 확인해보았습니다)
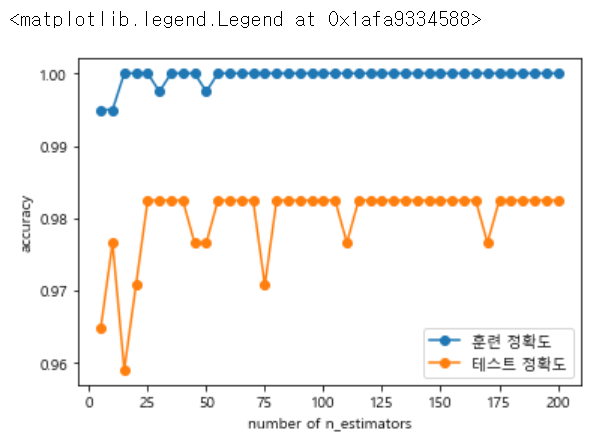
위의 그래프를 보면 test 정확도가 25일때 가장 최대이며, 더 이상 높아지지 않다는 것을 추정하면 n_estimators = 25로 지정할 수 있습니다.
# 3 max_features
depths=range(1,31)

tree_train,tree_test = [],[]

for i in depths:
    forest = RandomForestClassifier(n_estimators=25, random_state=25, max_features=i)
    forest.fit(X_train,y_train)

    tree_train.append(forest.score(X_train,y_train))
    tree_test.append(forest.score(X_test,y_test))

plt.plot(depths,tree_train,label='훈련 정확도',marker='o')
plt.plot(depths,tree_test,label='테스트 정확도',marker='o')
plt.ylabel('accuracy')
plt.xlabel('number of max_features')
plt.legend()
3 max_features 에서는 적합한 features의 수를 구하기 위한 작업입니다.
위에서 높게 나온 n_estimators와 random_state를 25로 지정해높고 1~ 31까지 반복문을 돌려줍니다.

위 그래프에서 test가 제일 높을 때 max_features의 값은 10인 것을 확인할 수 있습니다.
# 최종 확인
forest = RandomForestClassifier(n_estimators=25, random_state=25, max_features=10)
forest.fit(X_train,y_train)

print("train accuracy {:.2f}".format(forest.score(X_train,y_train)))
print("test accuracy {:.2f}".format(forest.score(X_test, y_test)))
마지막 최종확인으로 가장 적합한 값을 넣어서 최종 train, test 정확도를 확인해보았습니다.
train accuracy 1.00
test accuracy 0.99
이상으로 randomforest 모델을 이용하는 것을 공부했습니다.
'Code > 머신러닝 in Python' 카테고리의 다른 글
| [Python] LinearRegression(수치예측) (0) | 2019.08.28 |
|---|---|
| [Python] Gradient Boosting (0) | 2019.08.28 |
| [Python] RandomForest (0) | 2019.08.27 |
| [Python] DecisionTree (0) | 2019.08.27 |
| [Python] k-nearest neighbor 예제 (0) | 2019.08.26 |
[Python] RandomForest
What is Random Forest
- 여러개의 Decision Tree를 사용하는 앙상블 분류모형의 일종
- 앙상블의 사전적 의미 : 1.음악 ( 2인 이상에 의한 가창이나 연주) 2.음악 ( 주로 실내악을 연주하는 소인원의 합주단*합창단)
- 앙상블 러닝이 생겨난 배경 : 실제 데이터는 상당히 복잡하고, 여러 다양한 컨셉을 포함한. 따라서, 하나의 모델로 제대로 설명해내는데 어려움이 있음
- 앙상블은 여러 다른 모델의 결과를 결합하여 사용함으로써, 일반적으로 하나의 모델을 사용한 것보다 분석 결과가 좋음
랜덤포레스트를 위해 파이썬에서 임의의 데이터 셋을 만들어 확인해보겠습니다.
from sklearn.ensemble import RandomForestClassifier
from sklearn import datasets
from sklearn.model_selection import train_test_split
import numpy as np
import matplotlib.pyplot as plt

# 1. toy 데이터 생성하기
X, y = datasets.make_moons(n_samples=100, noise=0.25, random_state=3)

# 1.1 데이터 확인
X.shape

plt.scatter(X[:,0],X[:,1],edgecolors='red',s=50,c=y)

# 1.2 데이터 분할
X_train,X_test,y_train,y_test = train_test_split(X,y, test_size = 0.2, random_state = 1234)

# 1.3 분할 데이터 확인
X_train.shape, y_train.shape

# 2. random forest 모델링을 위할 객체 생성
# n_estimators : 만들 의사결정나무 개수
forest = RandomForestClassifier(n_estimators=5, random_state=5)

# 3. 모델 적합
forest.fit(X_train, y_train)

# 4. 결과 확인
print("train accuracy {:.2f}".format(forest.score(X_train, y_train)))
print("test accuracy {:.2f}".format(forest.score(X_test, y_test)))

# 5 트리 확인
forest.estimators_

# 5-1 트리 일부 확인
export_graphviz(forest.estimators_[0], out_file = "rf{}.dot".format(0),
                rounded=True, proportion=False,
                filled=True, precision=2)
with open("rf{}.dot".format(0)) as f1:
    dot_graph1 = f1.read()
graphviz.Source(dot_graph1)

소스를 작동하면 다음과 같은 의사결정나무0 이 출력되게 됩니다!
랜덤포레스트가 어떤 의사결정나무로 구성되었는지 확인하고 싶으면
export_graphviz(forest.estimators_[0], out_file = "rf{}.dot".format(0),
                rounded=True, proportion=False,
                filled=True, precision=2)
with open("rf{}.dot".format(0)) as f1:
    dot_graph1 = f1.read()
graphviz.Source(dot_graph1)
여기서 0을 5까지 변경시켜보면서 확인할 수 있습니다.
'Code > 머신러닝 in Python' 카테고리의 다른 글
| [Python] Gradient Boosting (0) | 2019.08.28 |
|---|---|
| [Python] RandomForest 예제 (0) | 2019.08.27 |
| [Python] DecisionTree (0) | 2019.08.27 |
| [Python] k-nearest neighbor 예제 (0) | 2019.08.26 |
| [Python]k-nearest neighbor (0) | 2019.08.26 |
[Python] DecisionTree
DecisionTree : 의사결정나무
- 어떤 항목에 대한 관측값과 목표값을 연결시켜주는 예측모델
- 시각적이고 명시적인 방법으로 의사 결정 과정과 결정된 의사를 보여주는 데 사용
- 데이터 분할을 하기 위해, 가장 훌륭한 변수가 무엇인지 찾아야함
간단한 파이썬으로 iris 데이터를 의사결정나무로 에측해본 것입니다.
# Decision Tree

# 필요 모듈 import
from sklearn.tree import DecisionTreeClassifier
from sklearn.datasets import load_iris
from sklearn import tree
from sklearn.model_selection import train_test_split

# 사이킷런의 iris 데이터 불러오기
iris_dataset = load_iris()

# data split
X = iris_dataset.data
y = iris_dataset.target
X_train, X_test, y_train, y_test = train_test_split(X,y,test_size=0.3, random_state = 25)

# 객체 생성
# max_depth : 사용자 설정에 따라 tree의 레벨 조정 가능
clf = tree.DecisionTreeClassifier(max_depth=None, random_state=0)

# 모델링
clf.fit(X_train, y_train)

print("훈련 세트 점수 {:3f}".format(clf.score(X_train, y_train)))
print("테스트 세트 점수 {:3f}".format(clf.score(X_test, y_test)))
여기서 해당 모델에 대해 시각적으로 확인하고 싶으면
# 아나콘다에서 설치 필요
#conda install graphviz
#conda install python-graphviz


import os

# 환경변수 조정
os.environ['PATH']+=os.pathsep+'C:/Anaconda3/Library/bin/graphviz/'

# 모델 저장
export_graphviz(clf, out_file = "iris.dot",
               feature_names=cancer.feature_names,
               class_names=cancer.target_names,
               rounded=True, proportion=False,
               filled=True, precision=2)

# 파일로 불러오기
with open("iris.dot") as f:
    dot_graph=f.read()

dot_graph

graphviz.Source(dot_graph)

소스를 돌리면 위와 같은 트리 그래프가 출력되게 됩니다.
'Code > 머신러닝 in Python' 카테고리의 다른 글
| [Python] RandomForest 예제 (0) | 2019.08.27 |
|---|---|
| [Python] RandomForest (0) | 2019.08.27 |
| [Python] k-nearest neighbor 예제 (0) | 2019.08.26 |
| [Python]k-nearest neighbor (0) | 2019.08.26 |
| 텍스트 분석_BOW (0) | 2019.08.14 |